 Français


Crops - Interactive table tutorial
🚀 Explore your new data display features
1. Build and export charts
Generate interactive charts
- Select relevant data
- Right click on your selection
- Select

- Export chart by clicking on
 (top right of the chart)
Tip - You can reverse year order when you select a commodity and all countries 
2. Customize column selection
Filter data according to your needs
- Click on top left icon
 to open menu
 - Click on
 to be able to type what you would like to filter
 - Click on
 to be able to tick or untick columns
3. Reorganize data
Select, drag and drop columns/rows
- For column - select the column and drag it right or left
- For row - select this icon
 to drag the row up or down
Tip - You can sort data in columns by clicking on ![]()
4. Export data to Excel
Download data in your preferred format
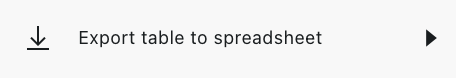
- Spreadsheet - right click and select "Export table to spreadsheet"
- CSV / XLS - access the download menu at the top of the page

📩 Email us at info@tallage.fr if you have any questions.